What is the difference between weather and climate?
Weather describes shorter-term atmospheric conditions. Climate describes longer-term patterns—and the reference period matters when someone says a day is “normal.”
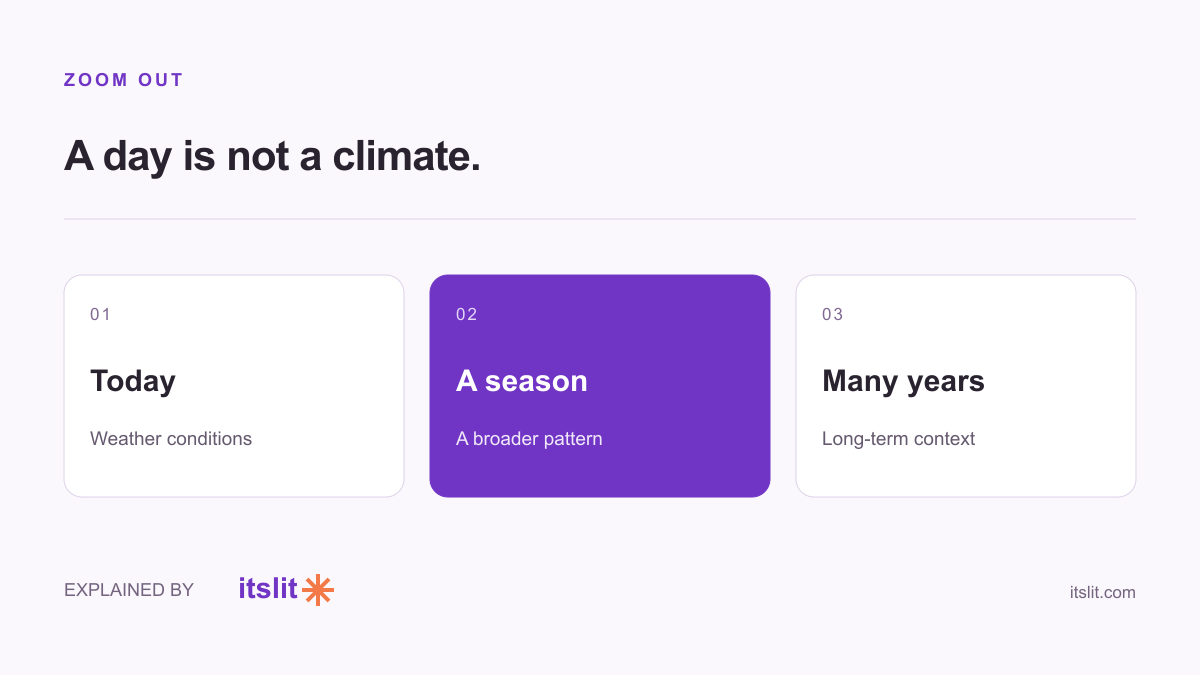
Weather is what the atmosphere is doing over shorter periods, such as today's rain or this week's temperatures. Climate describes longer-term patterns in a place. The distinction is about the time scale and the question being asked, as NOAA's National Centers for Environmental Information explains.
One answers “what happens today?”
Temperature, rain, wind, and humidity help describe weather. These conditions can change over minutes, hours, days, and weeks. A forecast for Saturday afternoon concerns a particular period, rather than the general character of a season.
For an illustrative example, imagine asking whether a fictional town will be wet during a Saturday picnic. “It often has rainy autumns” is useful background, but it does not answer the Saturday question. You still need a forecast for that place and time.
The other describes a longer pattern
Climate information can describe typical seasonal temperatures or precipitation over many years. It gives context for what is usual, without promising the conditions on one particular date.
Consider two imaginary planning questions. “What usually happens here in October?” asks for climate context. “What should we expect at 3 p.m. this Saturday?” asks for a weather forecast. They're related questions, but swapping one answer for the other loses information.
What does a climate normal mean?
A climate normal is a reference statistic, not a rule that each day must follow. NOAA's official U.S. Climate Normals use a uniform 30-year period and are produced every decade. The current conventional set covers 1991–2020; the service also provides supplemental shorter-period normals.
For example, an average for a month combines observations across the reference years. It is not a prediction that next month's every day will equal that average.
Here's an illustrative arithmetic example, not climate data: three numbers—10, 20, and 30—average 20. The average describes the set, even though two of the three values differ from it. Real climate statistics use far more data, but the distinction between an average and each individual observation remains useful.
Ask what “above normal” is compared with
If a chart calls a temperature above normal, look for the location, variable, and baseline years. Comparing a daily high with a monthly average, or comparing figures with different reference periods, can muddy the meaning.
The most useful follow-up to “Is this normal?” is “Normal for which place, which season, and which period?” That makes the comparison specific enough to understand.
Keep exploring: Understand rain probability · Compare weather forecasts.
Sources
What remains uncertain
This is a terminology explainer, not an attribution study of a particular storm or a forecast. Numerical examples are illustrative and do not describe a real location.
How this story was prepared
AI-assisted article prepared using the linked sources; not independently human-reviewed. Examples labeled illustrative are invented to explain the concepts, not reported observations.